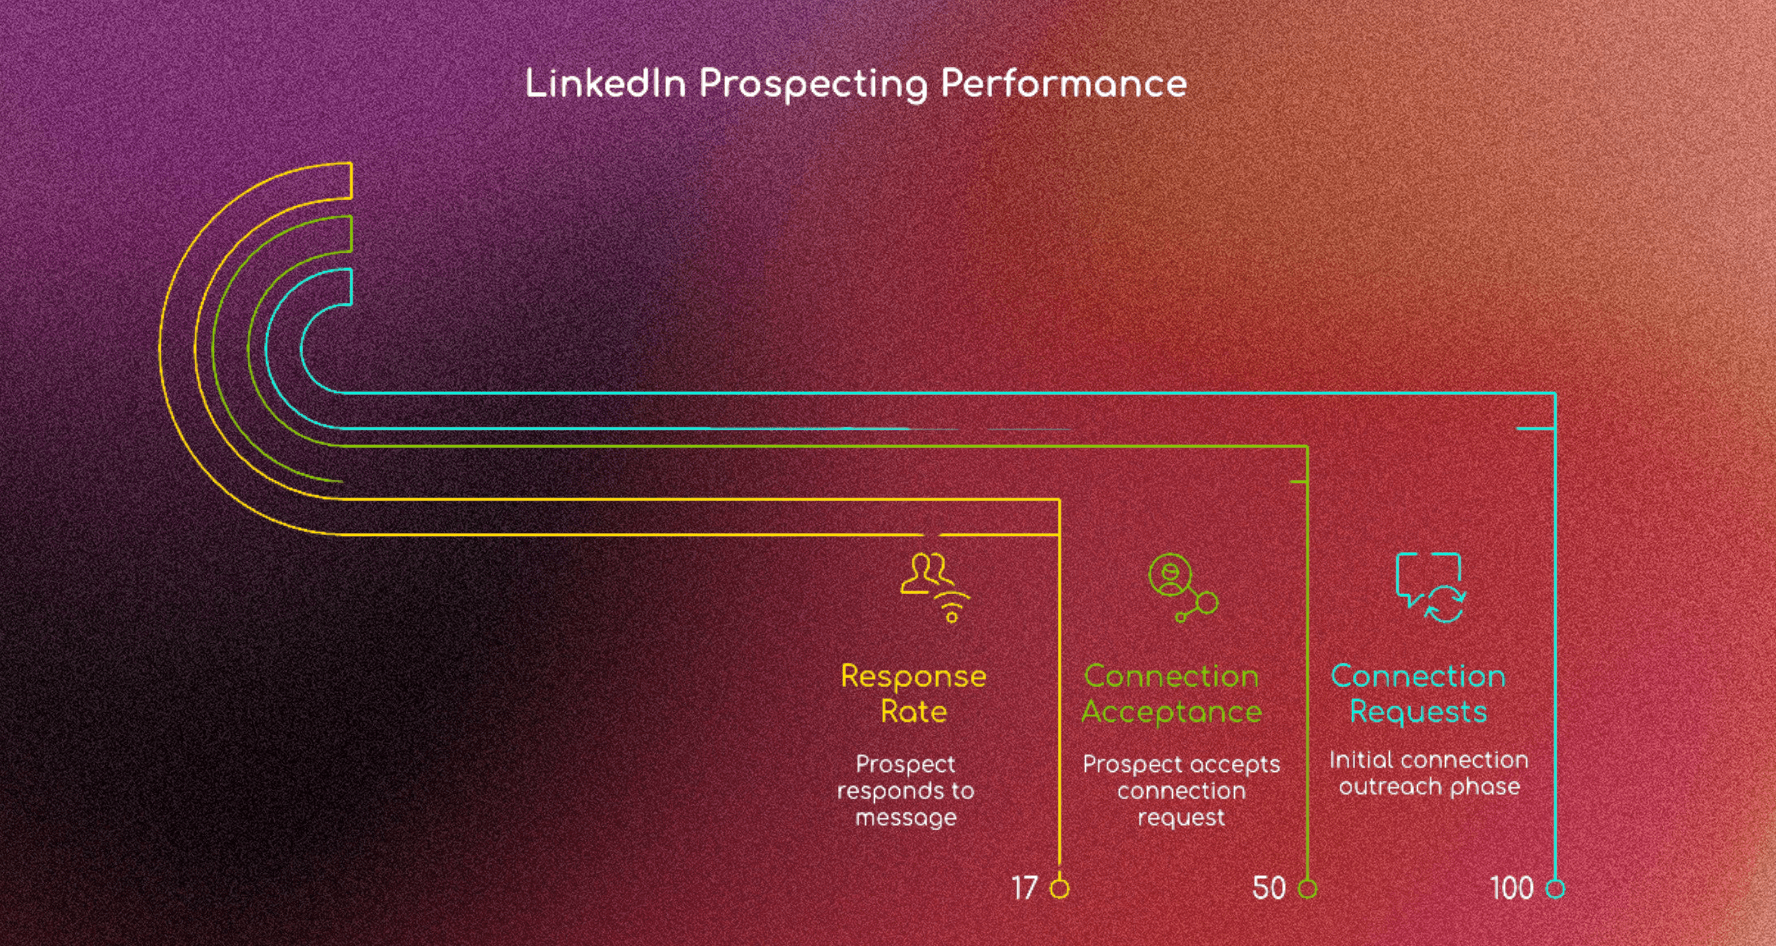
LinkedIn Prospecting Benchmarks: What Top 1% Sellers Track

Try Valley
Make LinkedIn your Greatest Revenue Channel ↓

Saniya Sood
The Hidden Performance Metrics That Separate Elite Revenue Teams From Everyone Else
While most sales teams obsess over vanity metrics like profile views and connection counts, top 1% LinkedIn performers track completely different KPIs that directly correlate with revenue generation. These elite sellers achieve 45-55% connection acceptance rates and 15-20% response rates while average performers struggle with 15-20% acceptance and 7% response rates.
Valley's AI-powered LinkedIn intelligence automatically tracks and optimizes the same performance metrics used by elite sellers, helping teams achieve top 1% results through systematic measurement and continuous improvement.
The difference isn't luck or natural talent- it's methodical tracking of performance indicators that actually predict pipeline growth.
The reality: Elite LinkedIn prospectors operate like revenue scientists, measuring every interaction that leads to closed deals while competitors chase meaningless engagement statistics.
The LinkedIn Performance Intelligence Gap That's Killing Your ROI
Here's what's actually happening with LinkedIn prospecting performance right now:
Average Performer Reality:
15-20% connection acceptance rates
7% message response rates
Generic outreach to cold lists
Focus on volume over quality metrics
Top 1% Elite Performance:
45-55% connection acceptance rates
15-20% message response rates
Signal-based targeting and personalization
Revenue-focused KPI tracking
The measurement gap: Most teams track LinkedIn activity metrics instead of revenue correlation metrics, missing the performance indicators that actually predict deal closure.

The Eight Revenue-Correlated Metrics Elite Sellers Track
Primary Revenue Generation KPIs
Connection-to-Meeting Conversion Rate
Elite performers achieve 25%+ meeting booking rates from connections
Average performers struggle with 10% meeting conversion
Performance indicator: Quality of initial targeting and personalization depth
Response Time Velocity
Top 1% sellers respond within 2 hours of prospect engagement
Average response time industry-wide: 24-48 hours
Revenue impact: Faster response correlates with 40% higher conversion rates
Pipeline Velocity Acceleration
Elite teams achieve sub-90-day sales cycles
Industry average: 120+ days from first touch to close
Measurement focus: LinkedIn touchpoint impact on cycle compression
Lead Quality Scoring
Top performers maintain 8+/10 lead quality scores
Average teams achieve 5/10 quality scores
Quality definition: ICP fit, intent signals, and buying authority verification
Advanced Performance Intelligence
Intent Signal Strength Tracking
Elite sellers score prospect intent 7+/10 before outreach
Mass outreach approaches average 4/10 intent strength
Signal categories: Website visits, job changes, content engagement, competitor research
Multi-Touch Attribution Analysis
Top performers track LinkedIn's role in 60%+ of deal influences
Traditional tracking misses 40% of LinkedIn-influenced revenue
Attribution model: First-touch, multi-touch, and last-touch impact measurement
Personalization Depth Correlation
High-performing messages achieve 95% customization levels
Generic template approaches deliver 20% customization
Measurement criteria: Research depth, contextual relevance, value proposition alignment
Real Performance Data: Elite vs Average LinkedIn Prospectors
Customer Success Benchmarks
Shilpi Goel, Leads the Way Agency: "I got a 71% response rate with 600 prospects. Acceptance is about 30% and response is about 71%. I've already booked six meetings with five more in the pipeline. I'll be booking 11-12 meetings for this client."
Lukas Gelžinis, Salesforge: "Out of 200 messages I had 16 positive replies. I already booked 10 meetings with that. The average campaign with connections has a 46% reply rate."
Performance Analysis:
Shilpi's results: 71% response rate demonstrates exceptional performance
Lukas's conversion: 46% reply rate shows superior engagement
Meeting conversion: Both achieving strong booking rates vs industry standards
Industry Performance Comparison
Performance Level | Connection Acceptance | Response Rate | Meeting Conversion | Pipeline Velocity |
|---|---|---|---|---|
Top 1% Sellers | 45–55% | 15–20% | 25%+ | <90 days |
Above Average | 35–40% | 12–15% | 18–22% | 90–110 days |
Industry Average | 25–30% | 7–10% | 10–15% | 120+ days |
Below Average | 15–20% | 3–7% | 5–10% | 150+ days |
Key insight: Top performers achieve significantly better results across all metrics through systematic performance tracking and optimization.
Why Valley's Performance Intelligence Creates Elite Results
While traditional LinkedIn tools focus on sending volume, Valley provides the performance intelligence and automation that elite sellers use to achieve top 1% results.
Valley's Elite Performance Framework
Comprehensive Performance Tracking:
Real-time response rate monitoring by message type and prospect segment
Connection acceptance tracking with ICP fit correlation analysis
Meeting conversion measurement from initial LinkedIn touch to booked call
Pipeline attribution showing LinkedIn's role in deal progression
As Lukas Gelžinis explains: "Valley generates good enough messaging 40% of the time straight away. With minimal training, I get that close to 80%." This performance improvement reflects Valley's ability to learn and optimize based on actual response data.
The 30-40 Minute Research Advantage
Valley's deep prospect analysis includes:
Performance-Driven Research - ICP qualification, intent scoring, and response likelihood assessment Quality Optimization - Message personalization that correlates with higher response rates Timing Intelligence - Optimal outreach timing based on prospect behavior patterns Conversion Tracking - Meeting booking attribution from LinkedIn engagement
As Shilpi Goel notes: "You can upload the link directly, it pulls up the data very nicely, then immediately gives you ICP fitment, qualification, scoring, and reasoning. The depth of research is fantastic."
Traditional Tool Performance Gaps vs Valley's Intelligence
Competitive Performance Analysis
Traditional LinkedIn Automation Limitations:
Generic response rate tracking without quality correlation
Volume-focused metrics ignore conversion optimization
Manual performance analysis requires significant time investment
No predictive intelligence for prospect prioritization
Valley's Performance Intelligence:
Quality-weighted response tracking shows which message types convert to meetings
ICP fit correlation analysis identifies highest-converting prospect characteristics
Automated performance optimization improves results without manual intervention
Predictive prospect scoring prioritizes outreach for maximum ROI
Balazs Vojtek achieved "four meetings in the first week and at least six more since then" using Valley's performance-optimized approach.
Revenue-Correlated KPI Framework
Conversion Funnel Metrics:
Performance Benchmarks by Funnel Stage:
Profile to Connection: Strong targeting correlation for qualified prospects
Connection Acceptance: Higher rates with personalized requests
Message Response: Improved engagement with signal-based targeting
Response to Meeting: Better conversion with value-focused messaging
Meeting to Opportunity: Higher conversion with qualified prospects
Opportunity to Close: Better rates with proper LinkedIn nurturing
Valley's Performance Intelligence Implementation
Automated Quality Scoring: Valley automatically tracks and optimizes:
Prospect quality correlation with response and conversion rates
Message personalization impact on engagement metrics
Timing optimization for maximum response probability
ICP refinement based on actual conversion data
Anthony Richards emphasizes: "You have to come in with a testing mindset and be willing to iterate and keep a pulse check. You're not just going to click launch and disappear. You need to stay on top of this and manage it - that's where you're going to see results."
LinkedIn Performance Optimization Strategies for Elite Results
Multi-Variable Testing Framework
Message Performance Testing:
A/B testing different personalization depths to find optimal research investment
Subject line optimization for higher open and response rates
Value proposition testing to identify most compelling messaging approaches
Call-to-action optimization for maximum meeting conversion
Targeting Performance Analysis:
ICP refinement based on actual response and conversion data
Intent signal weighting to prioritize highest-converting prospects
Industry performance comparison to optimize sector-specific approaches
Timing analysis to identify optimal outreach windows
Valley's Automated Optimization Engine
Performance Learning Loop:
Campaign execution with comprehensive performance tracking
Response pattern analysis to identify successful approaches
Message optimization based on highest-performing elements
Prospect scoring refinement using conversion correlation data
Customer Training and Optimization: As Shilpi Goel discovered: "What I love is that you can try out different ICPs and products very quickly. The speed to market is really good because you can iterate and do what works."
LinkedIn Performance That Actually Matters
Revenue Attribution Framework
Direct Revenue Tracking:
LinkedIn-sourced deals: Average $50K+ deal sizes from elite performers
Pipeline acceleration: 15-30% cycle reduction through LinkedIn engagement
Cost per qualified meeting: <$100 for top 1% sellers vs $200+ average
Customer acquisition cost: 25% lower when LinkedIn is primary channel
Performance ROI Calculation:
Result: Significant revenue improvement through performance-focused optimization
Valley's ROI Intelligence
Comprehensive Performance Measurement:
Real-time campaign ROI tracking from LinkedIn touch to closed deal
Prospect quality correlation with deal size and close probability
Message performance attribution showing which approaches drive revenue
Time-to-value optimization reducing manual work while improving results
Balazs Vojtek explains the workflow impact: "With Valley we shortened our workflow and everything is inside, so we don't need to set up so many different long workflows. This makes the work much easier and creates amazing results."
Industry-Specific Performance Benchmarks and Optimization
Sector Performance Analysis
Technology/SaaS Elite Performance:
Strong connection acceptance rates with technical buyers
Good response rates for product-focused messaging
Higher deal values support intensive personalization investment
Professional Services Excellence:
Strong connection acceptance through relationship-focused approaches
Good response rates emphasizing industry expertise
Medium deal values with longer relationship development cycles
Financial Services Performance:
Conservative connection acceptance due to professional culture
Moderate response rates requiring compliance-aware messaging
High deal values justify extensive research and personalization
Valley's Industry Intelligence
Sector-Specific Optimization: Valley's AI automatically adapts messaging and timing based on:
Industry-specific response patterns and optimal engagement windows
Buyer persona preferences for different professional sectors
Compliance considerations for regulated industries
Value proposition alignment with sector-specific pain points
Implementation: Building Your Elite Performance System
Phase 1: Performance Infrastructure Setup
Week 1-2: Baseline Measurement
Implement comprehensive tracking for all LinkedIn activities
Establish baseline performance across key conversion metrics
Identify current gaps compared to elite performer benchmarks
Configure automated performance monitoring systems
Valley Integration Benefits:
Automatic performance tracking eliminates manual measurement work
Pre-configured elite benchmarks provide immediate performance comparison
Real-time optimization alerts identify improvement opportunities
Integrated analytics dashboard centralizes all performance intelligence
Phase 2: Performance Optimization
Week 3-4: Data-Driven Improvement
Analyze performance gaps across prospect quality, messaging, and timing
Implement A/B testing for highest-impact optimization opportunities
Refine ICP targeting based on actual conversion correlation data
Optimize message personalization depth for maximum ROI
Valley's Performance Intelligence:
AI-powered optimization recommendations based on actual performance data
Automated A/B testing for message and targeting approaches
Performance benchmark comparison with top 1% seller standards
Continuous learning algorithms that improve results over time
Phase 3: Elite Performance Scaling
Week 5+: Systematic Excellence
Scale successful performance patterns across entire team
Implement advanced attribution tracking for full revenue correlation
Establish performance review cycles for continuous optimization
Expand successful approaches to new market segments and ICPs
Strategic Recommendations for Revenue Leaders
Performance-First LinkedIn Strategy
Investment Allocation for Elite Results:
60% focus on quality metrics over volume metrics
30% investment in performance intelligence and optimization tools
10% allocation for advanced testing and experimentation
Team Performance Development:
Weekly performance reviews focusing on revenue-correlated metrics
Monthly optimization cycles based on conversion data analysis
Quarterly strategy adjustments aligned with elite performer benchmarks
Annual performance system upgrades incorporating latest intelligence tools

Valley's Complete Performance Solution
For teams ready to achieve top 1% LinkedIn performance:
Automated Performance Intelligence tracks all revenue-correlated metrics automatically
AI-Powered Optimization continuously improves results based on actual data
Elite Benchmark Comparison shows exactly where performance improvements are needed
LinkedIn Safety Compliance maintains account integrity while scaling performance
Dedicated Performance Coaching ensures optimal implementation and results
As Shilpi Goel says: "Valley is a kickass tool! I recently demoed another LinkedIn 'allbound' platform, and it didn't even come close. I'm super excited to scale from 3 to 6 seats!"
The Elite LinkedIn Performance Advantage
Top 1% LinkedIn sellers don't achieve superior results through luck or natural talent—they systematically track and optimize performance metrics that directly correlate with revenue generation. Elite performance comes from measuring what matters and continuously improving based on actual conversion data.
Traditional LinkedIn approaches focus on activity metrics that don't predict revenue outcomes. Elite sellers track conversion-focused KPIs that show exactly which prospects, messages, and timing strategies generate the most meetings and deals.

Valley makes elite LinkedIn performance accessible at scale through automated intelligence that tracks, analyzes, and optimizes the same metrics used by top 1% performers.
Ready to join the top 1% of LinkedIn sellers through performance intelligence?
Book a demo today to see how elite-level tracking and optimization transforms LinkedIn prospecting into predictable revenue generation.
Transform your LinkedIn performance with intelligence systems that deliver top 1% results.

Related Blogs


Which channels does Valley support?
Valley supports LinkedIn outreach, including connection requests and InMails. Valley users safely send 1000-1200 messages per seat every month.
How safe is it and does Valley risk my LinkedIn account?
Do I have to commit to an Annual Plan like other AI SDRs?
How does Valley personalize messages?

VALLEY MAGIC


