

What Are Sales KPIs?
Imagine spending hours fine-tuning your sales strategy, only to find it’s not delivering the results you expected. Without the right metrics, it’s like driving blind; you don’t know what’s working, what’s not, or where to make adjustments. That’s where sales KPIs (Key Performance Indicators) come in.
We know how discouraging it can be to put in the work, follow the playbook, and still feel like you’re missing the mark, especially when you can’t pinpoint why.
Sales KPIs are the essential metrics that help you measure how your sales team and processes are performing. They highlight what’s going well, reveal areas that need attention, and keep your efforts aligned with overall business goals.
Whether you're in SaaS, tech consulting, or selling high-ticket services, tracking the right KPIs is key to optimizing your strategy and driving consistent growth.
In this article, we’ll break down what sales KPIs are, look at the most important ones to track, and explain how they can help you hit your sales targets more efficiently.
TL; DR
Sales KPIs track how well your sales efforts support business goals, focusing on outcomes like revenue, conversions, and retention.
Unlike activity-based metrics, KPIs measure long-term performance and guide strategic decisions and accountability.
Choosing the right KPIs depends on your business stage; prioritize leading indicators that align with your sales funnel.
Tools like CRMs and AI analytics help monitor trends, automate forecasting, and improve sales performance in real time.
What Are Sales KPIs?
Sales KPIs (Key Performance Indicators) are measurable metrics that help you understand how well your sales team is performing against business goals. They go beyond just tracking day-to-day activities; KPIs give you a clear picture of what’s driving revenue and results.
For B2B companies, especially in SaaS, tech consulting, or high-ticket services, KPIs are essential. They keep your sales efforts aligned with larger business objectives and give you insights into what’s working, what’s not, and where to improve.
Think of them as your sales dashboard. Whether it’s measuring the length of your sales cycle, your customer acquisition cost, or your close rate, these indicators help you make smarter decisions, fine-tune your strategy, and grow more efficiently, especially if you're in a fast-moving, growth-stage company.
Before going deep into specific KPIs, you need to understand how they differ from general sales metrics.
Sales Metrics vs. Sales KPIs
In sales, it’s easy to get overwhelmed by all the numbers flying around. However, not all data points are created equal, and understanding the distinction between sales metrics and sales KPIs is crucial if you want to track performance in a way that actually drives results.
While the two are closely related, they play different roles in your sales process, and understanding how each works helps you focus on what really drives results. Below are the differences between sales metrics and sales KPIs.
Aspects | Sales Metrics | Sales KPIs |
Definition | Quantitative data points measuring individual activities and sales actions. | Strategic indicators measuring outcomes tied to business goals. |
Focus | Tracks day-to-day sales activity and productivity. | Tracks performance against key business objectives. |
Examples | Calls made, emails sent, demos scheduled, meetings attended. | Sales quota attainment, lead-to-opportunity conversion rate, and sales growth. |
Purpose | Measures specific actions and provides insights into sales activity levels. | Measures whether sales strategies are effective in achieving business targets. |
Timeframe | Often short-term, focusing on daily or weekly tasks. | Long-term focus on business goals and overall sales performance. |
Relevance to Business Goals | Helps assess individual actions but may not directly link to business outcomes. | Directly tied to revenue generation, customer acquisition, and profitability. |
Impact | Provides data to optimize individual productivity. | Provides actionable insights to guide strategic decisions and business growth. |
Use in B2B Sales | Useful for measuring individual sales reps or team activity. | Essential for aligning sales efforts with broader business objectives like revenue growth and customer retention. |
Understanding the difference between metrics and KPIs gives you clarity, but knowing why KPIs matter in the first place is what makes them truly powerful.
Importance of Sales KPIs
Sales KPIs are crucial for keeping your sales team focused and aligned with your company’s broader objectives. For B2B teams, these KPIs provide a clear snapshot of how effectively your strategies are driving revenue and growth.
They help you measure what matters, spot what’s working (and what’s not), and make smarter decisions to keep moving in the right direction.
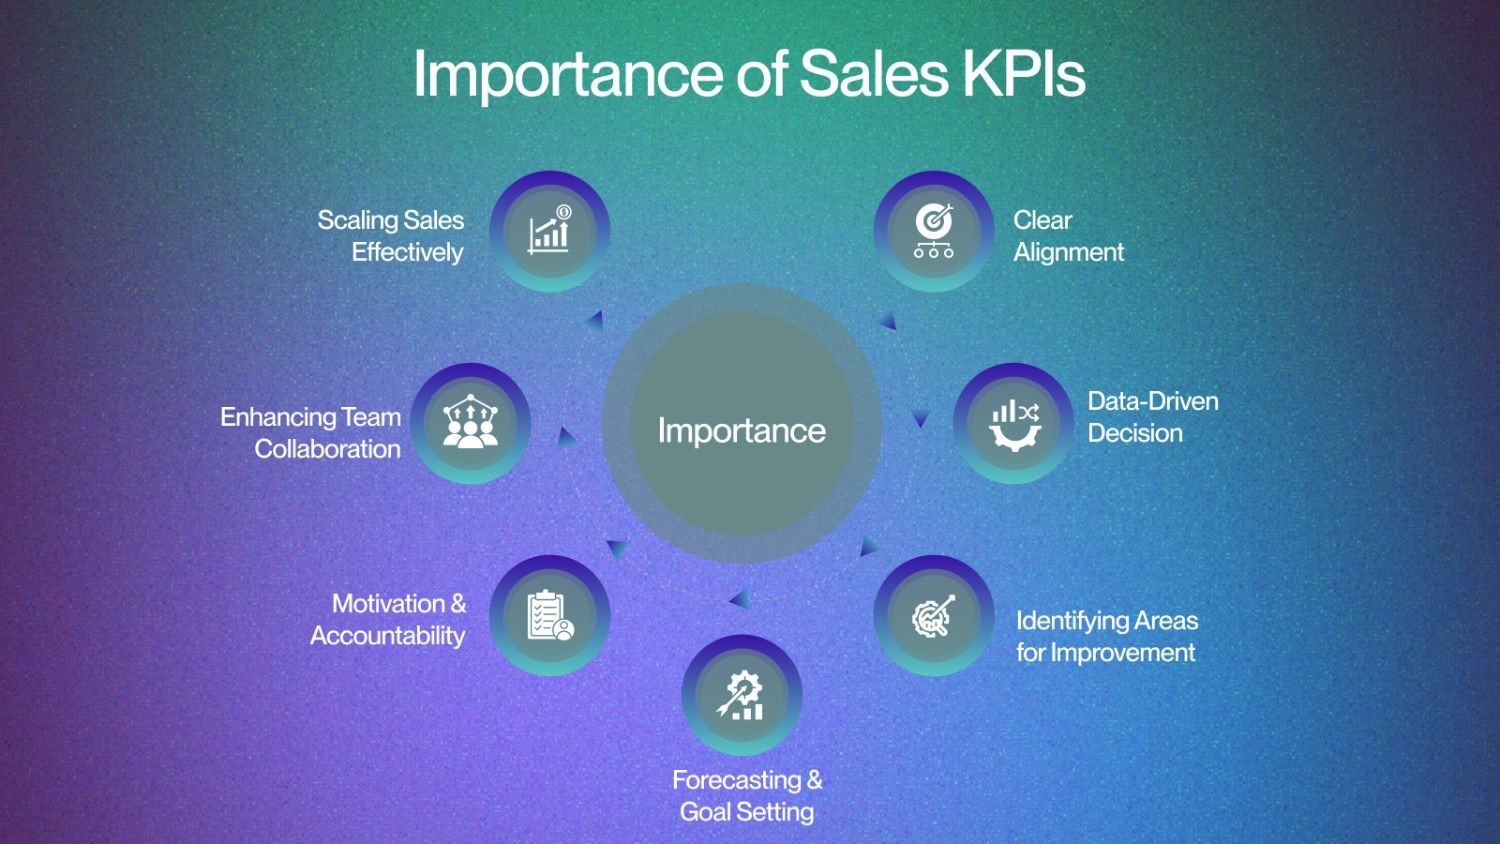
Here’s why sales KPIs matter so much for long-term success:
Clear Alignment with Business Goals
Sales KPIs help your team stay focused on what truly matters, enabling them to achieve the company’s broader objectives. KPIs like sales growth, lead conversion rate, and customer acquisition cost (CAC) make it easier to connect everyday sales efforts to real business impact.
Data-Driven Decision Making
KPIs give you the facts, not just gut feelings. Sales leaders can use this data to refine their strategies, allocate resources effectively, or invest in training where it matters most. Real-time insights help you act quickly and confidently.
Identifying Areas for Improvement
Tracking KPIs allows you to zoom in on what’s working and where adjustments are needed. Whether it’s long sales cycles or low demo-to-close rates, KPIs point you to the areas that need attention, so you’re not guessing.
A rising sales cycle length could indicate that leads are not being properly qualified. This insight could prompt a review of your qualification criteria or early-stage nurturing process.
Better Forecasting and Goal Setting
When you know your numbers, you can predict your future. Sales KPIs enable teams to create more accurate forecasts, set achievable quotas, and plan resources more efficiently, providing the confidence to grow sustainably.
If your team consistently converts 10% of leads into opportunities, you can work backward from your revenue goals to figure out how many leads you actually need.
Motivation and Accountability
KPIs make performance visible. When reps know what they’re being measured on, it creates accountability and drives motivation. It also gives managers a clear picture of who’s excelling and who might need extra support.
Enhancing Team Collaboration
When KPIs are shared across departments, such as sales and marketing, they encourage better alignment and teamwork. Everyone works toward the same outcomes, improving lead quality, follow-up, and overall customer experience.
Scaling Sales Effectively
As your business grows, KPIs help keep operations streamlined. They make it easier to monitor performance across larger teams, identify gaps, and maintain quality while scaling.
Tracking KPIs allows you to zoom in on what’s working and where adjustments are needed.
You Might Also Like: 7 Signal-Led Prospecting Tactics for B2B Sales Growth.
How to Choose the Right KPIs?
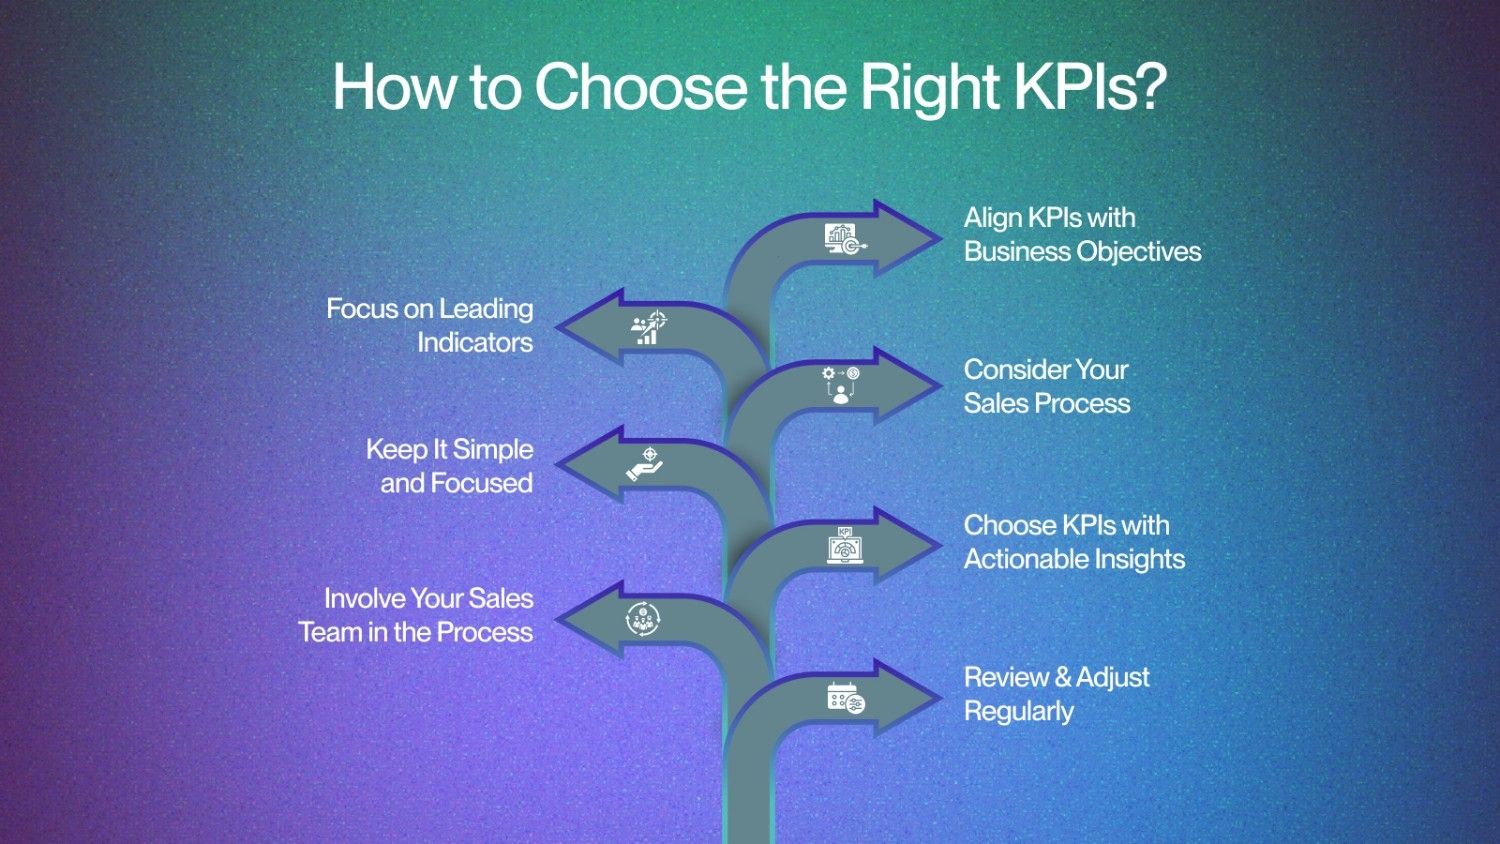
Selecting the right sales KPIs is crucial for measuring success, enhancing performance, and ensuring your sales team is aligned with strategic business objectives. For B2B companies, especially in SaaS, tech consulting, and high-ticket service industries, this means focusing on actionable KPIs, aligned with your sales process, and tailored to your stage of growth. Here’s how to identify the most relevant KPIs for your team:
Align KPIs with Business Objectives
Start by ensuring your KPIs reflect what the business is trying to achieve. Whether the focus is on increasing revenue, acquiring new customers, or enhancing customer retention, your KPIs should align directly with those goals.
For instance, if your goal is to increase revenue by 20%, metrics such as sales quota attainment and sales growth will help you measure progress and adjust your strategy accordingly.
Focus on Leading Indicators
Leading indicators help you predict future outcomes and take proactive steps before performance declines. These include activity-based metrics, such as lead conversion rates, emails sent, or calls made, which provide early insight into whether your team is on track.
For example, if you notice a decline in your lead-to-opportunity conversion rate, it may signal an issue with lead quality or follow-up processes, providing an opportunity to intervene before revenue is impacted.
Consider Your Sales Process and Funnel
Your KPIs should reflect your unique sales cycle and funnel stages. High-ticket service providers and consulting firms often encounter longer, more complex sales cycles, making metrics such as sales cycle length, deal size, and close rate increasingly important.
For instance, if customer retention is a key growth lever, tracking NRR will help ensure you’re not only keeping customers but growing revenue from existing accounts.
Keep It Simple and Focused
Tracking too many KPIs can lead to analysis paralysis. Start by selecting a focused set of high-impact metrics for each team or function. Choose KPIs that clearly reflect performance and influence strategic decisions.
For example, a growing B2B sales team might focus on just three KPIs: sales pipeline growth, sales velocity, and Customer Acquisition Cost (CAC). These give a clear picture of funnel health, efficiency, and ROI, without overwhelming the team.
Choose KPIs with Clear, Actionable Insights
Every KPI should answer the question: “What can we do with this data?” The best KPIs highlight areas for improvement and guide decisions around strategy, training, or resource allocation.
For instance, if your sales cycle length is increasing, it may indicate bottlenecks in your process or a need for more frequent follow-ups. This insight allows your team to take immediate action, such as refining messaging or reworking touchpoints.
Involve Your Sales Team in the Process
KPIs are most effective when your sales team understands and buys into them. Involve your reps, SDRs, and marketers in KPI selection so the metrics reflect their daily work and encourage ownership.
For example, if SDRs are aligned on KPIs such as response rate or qualified leads delivered, they’ll be more engaged in optimizing their outreach strategy and achieving targets that matter.
Review and Adjust Regularly
Your KPIs should evolve as your business grows. What made sense at an early stage might not be relevant six months down the line. Regularly revisit your KPIs to ensure they still align with current goals, customer behavior, and market dynamics.
After understanding how to pick the right KPIs, you need to see what that looks like in action.
Also Read: AI for Sales Prospecting: The Complete Guide for 2025.
37 Sales KPIs for Sales Teams to Track
Tracking the right sales KPIs (Key Performance Indicators) is crucial for B2B sales teams, particularly in industries such as SaaS, tech consulting, and high-ticket services.
These KPIs provide clear visibility into how well your sales strategy is working, where improvements are needed, and how closely your team’s efforts align with overall business objectives.
Below are 37 essential sales KPIs that every B2B sales team should track to optimize their sales process and accelerate business performance:
Sales Activity & Productivity KPIs
These metrics measure how actively and efficiently your sales team is engaging prospects.
Sales by Contact Method
This KPI helps you track the effectiveness of different communication channels, such as calls, emails, and social media, in driving sales. Especially for B2B teams using tools like LinkedIn Sales Navigator, understanding which method works best helps improve lead conversion and team efficiency.
Formula: (Total sales from calls, emails, or social outreach / Total sales) x 100
Monthly Calls (or Emails) Per Sales Rep
This tracks the number of outreach activities your reps complete each month. It’s a basic but important measure of activity and engagement.
Formula: Total number of calls (or emails) / Number of sales reps
Number of Emails Sent
This tracks email volume per sales rep, showing the level of engagement and follow-up activity.
Formula: Total number of emails sent / Number of sales reps
Number of Calls Made
Measures how many calls your team makes. More outreach usually means more opportunities to close.
Formula: Total number of calls made / Number of sales reps
Number of Meetings Booked
Shows how many meetings were scheduled with prospects. It reflects how well your team is qualifying and engaging leads.
Formula: Total number of meetings booked / Number of sales reps
Number of Monthly Onboarding and Demo Calls
This tracks how often your team provides demos or onboarding. Especially in SaaS, consistent demos help improve conversions.
Formula: Total number of demo or onboarding calls / Number of sales reps
Average Call Duration
This tells you how long reps spend on calls with prospects. Longer calls may indicate stronger engagement.
Formula: Total duration of calls / Number of calls made
Longer calls may indicate stronger engagement. But call volume and length alone don’t tell the full story. Valley helps tie those activities back to intent, flagging which leads are actually progressing and which ones need a more tailored follow-up, so your team spends time where it counts.
Number of Offers Sent
This tracks the number of proposals or offers sent to prospects. It gives a good sense of deal flow.
Formula: Total number of offers sent / Number of sales reps
Pipeline & Conversion KPIs
These help you understand how well leads are moving through your funnel and where bottlenecks may exist.
Sales Opportunities
Sales opportunities are prospects who have shown interest and are being pursued by your team. Tracking this KPI helps you understand how many deals are actively in progress. It's beneficial for growing tech consulting teams that want to focus their efforts on high-potential leads.
Formula: Number of prospects showing interest / Number of leads in your pipeline
Quote-to-Close Ratio
This metric tells you how many proposals or quotes actually result in closed deals. A high ratio indicates that your team is doing a great job of converting interest into revenue. For SaaS and tech consulting, this directly impacts sales efficiency.
Formula: Number of closed deals / Number of quotes sent
Lead-to-Sale %
This shows the percentage of leads that end up as paying customers. It’s a clear indicator of how strong and efficient your sales process is.
Formula: (Number of sales / Number of leads) x 100
Win Rate
This KPI shows what percentage of sales opportunities turn into closed deals. It's a good reflection of how effective your team is at closing.
Formula: (Number of deals won / Number of opportunities) x 100
Hit Rate
Hit rate indicates the percentage of your leads that actually convert into sales. It’s useful for assessing lead qualification and outreach strategy.
Formula: (Number of sales / Number of leads) x 100
Conversion Rate
This indicates the percentage of leads that become paying customers. It's a strong indicator of your team’s ability to close deals.
Formula: (Number of sales / Number of leads) x 100
Average Sales Cycle Length
This indicates the average time it takes to close a deal, from initial contact to final sale. Shorter cycles typically mean a more efficient sales process.
Formula: Total number of days from first contact to close / Number of deals closed
Shorter cycles typically mean a more efficient sales process. Valley helps your team respond faster to warm leads, keep conversations moving, and reduce friction across the funnel, all of which contribute to shorter, healthier sales cycles.
Average Conversion Time
This measures how long it takes for a lead to become a customer. It's a useful metric for checking the effectiveness of your lead-nurturing efforts.
Formula: Total time from first contact to conversion / Number of conversions
Average New Deal Size/Length
This KPI gives insight into the average value and duration of new deals. It helps assess financial potential and how efficiently deals are closed.
Formulas:
Average Deal Size = Total deal value / Number of deals
Average Deal Length = Total deal length (in days) / Number of deals
Pipeline Velocity
This KPI measures how fast deals move through your pipeline. Faster movement usually means quicker revenue generation.
Formula: (Number of opportunities x Average deal value x Win rate) / Length of sales cycle
Projected Pipeline Sales Value
This estimates the total value of all ongoing sales opportunities. It's important for forecasting and planning.
Formula: Total value of active deals in the pipeline
Revenue, Profitability & Growth KPIs
These metrics focus on sales growth, efficiency, and financial performance.
Sales Target
This KPI shows how close your team is to reaching its revenue goals within a given timeframe. It's a key measure for B2B SaaS and service companies to align sales strategy with broader business targets.
Formula: (Sales achieved / Sales target) x 100
Sales per Rep
This metric helps evaluate each sales rep’s performance by measuring the sales they generate. It’s a simple way to identify top performers and those who might need support.
Formula: Total sales / Number of sales reps
Revenue per Sales Rep
This measures how much revenue each rep brings in. It helps evaluate performance and guide training efforts.
Formula: Total revenue / Number of sales reps
Product Performance
This KPI measures how well individual products or services are selling. It helps you understand what drives revenue and where to direct your team’s attention.
Formula: (Sales of specific product / Total sales) x 100
Average Purchase Value
This shows the average revenue generated from each transaction. It's a good indicator of customer spending behavior and can help fine-tune your pricing strategy.
Formula: Total revenue / Number of transactions
Monthly Sales Growth
Measures month-over-month sales performance. It helps track whether your sales strategy is driving consistent growth.
Formula: {(Sales this month - Sales last month) / Sales last month} x 100
New Business Revenue
Tracks revenue from newly acquired customers. It helps assess how well your lead generation and conversion strategies are working.
Formula: Revenue from new customers / Total sales
Monthly Sales Bookings
Tracks the total value of deals closed in a month. It’s a great way to measure monthly sales performance.
Formula: Total value of deals closed in the month
Repeat Business Revenue
This measures the income from returning customers. It highlights the success of your retention and relationship-building efforts.
Formula: Revenue from returning customers / Total sales
Average Profit Margin
Tracks how much profit you make on each sale. It’s key to ensuring your business remains financially healthy.
Formula: (Total profit / Total sales) x 100
New and Expansion MRR
This metric adds up new monthly recurring revenue and any revenue from customer upgrades. It’s essential for SaaS businesses focused on growth.
Formula: New MRR + Expansion MRR
Customer Retention & Value KPIs
These metrics indicate how effectively you're retaining customers and the long-term value they generate.
Customer Acquisition Cost (CAC)
CAC tells you how much you spend to acquire each new customer. It helps gauge the financial efficiency of your sales and marketing.
Formula: Total sales and marketing expenses / Number of new customers acquired
Customer Lifetime Value (CLV or LTV)
CLV shows the total revenue you can expect from a customer over their lifetime. It's useful for deciding how much to invest in acquiring and retaining them.
Formula: Average purchase value x Purchase frequency x Customer lifespan
Customer Retention
This measures how many customers stick around over time. High retention means satisfied customers and steady revenue.
Formula: (Number of retained customers / Total number of customers at the start of the period) x 100
Retention Rate by Sales Rep
This shows how well each rep maintains long-term customer relationships. For SaaS teams, it’s crucial to reduce churn.
Formula: (Number of retained customers / Total number of customers) x 100
Churn Rate
Churn rate tracks the percentage of customers who stop doing business with you. It helps evaluate customer satisfaction and retention.
Formula: (Number of customers lost / Total number of customers at the start of the period) x 100
Save Rate
Save rate shows how well your team can recover at-risk deals. It's especially valuable for SaaS businesses aiming to reduce churn.
Formula: (Number of deals saved / Total number of at-risk deals) x 100
Lead Generation & Funnel Input KPIs
These indicate how well your team is filling the top of the funnel.
New Leads
Tracks how many new prospects enter your pipeline. A steady stream of new leads is key for growth.
Formula: Number of leads generated within a specific period
Knowing which KPIs to track is just the beginning; what really matters is how you keep an eye on them day-to-day.
Also Read: How to Use LinkedIn for Effective Sales Prospecting.
How Do You Track Sales KPIs?
Tracking sales KPIs is essential for understanding what’s working in your sales strategy and where there’s room to improve. For B2B teams, keeping a close eye on these metrics helps ensure your team is focused on the right actions, consistently meeting targets, and driving sustainable revenue growth.
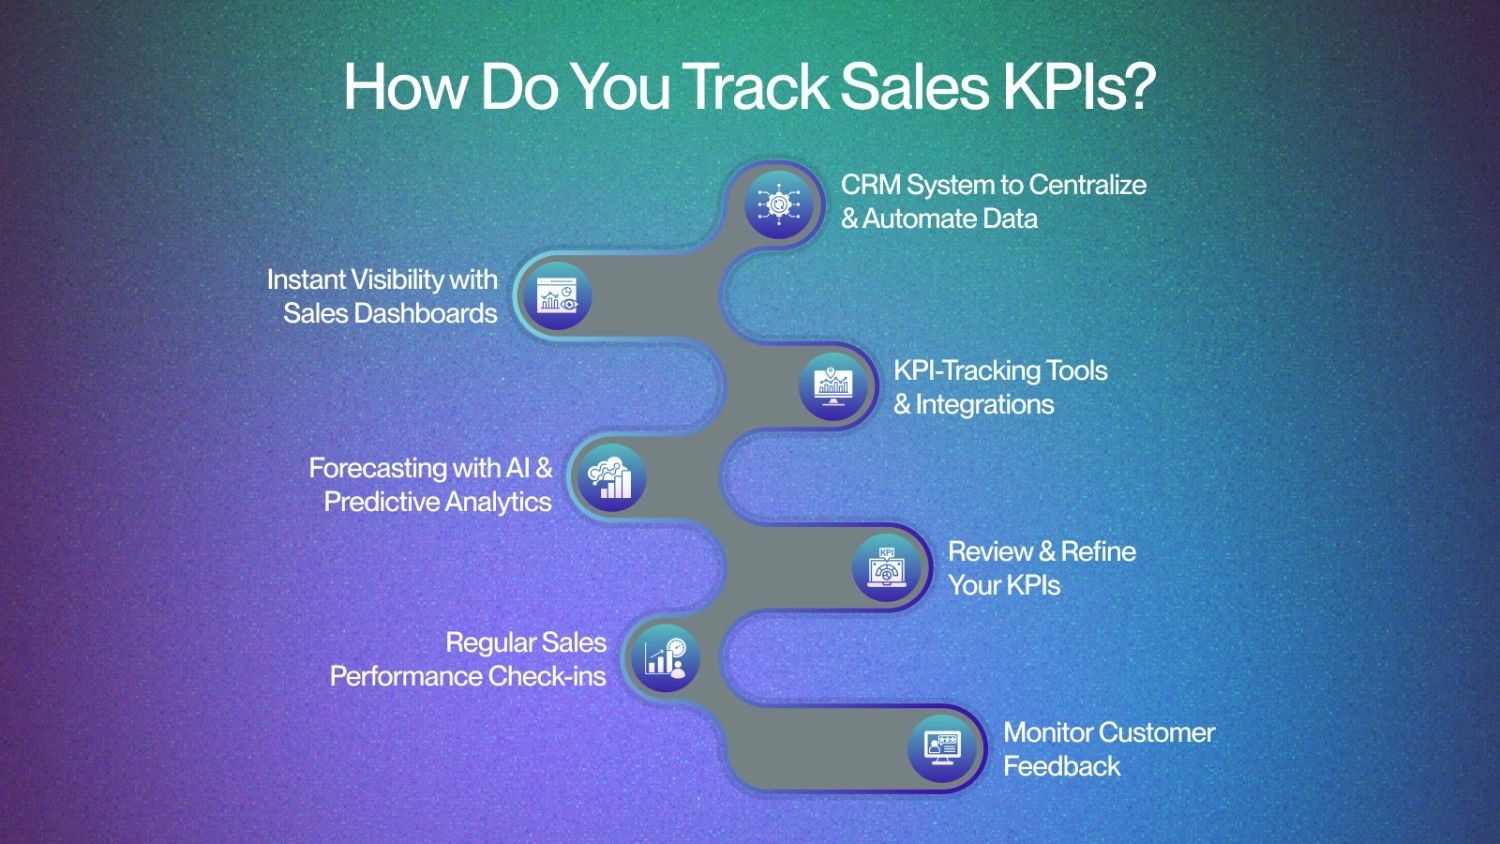
Here’s a practical look at how to track sales KPIs effectively:
Use a CRM System to Centralize and Automate Data
CRM platforms, such as Salesforce, HubSpot, or Pipedrive, make it easier to manage and track sales activities. They automatically log lead interactions, monitor deal stages, and calculate key metrics like conversion rates, sales cycle length, and average deal size.
By consolidating all your customer and prospect data into one place, CRMs provide a clear, real-time view of your sales performance.
Get Instant Visibility with Sales Dashboards
Sales dashboards give your team a quick snapshot of performance metrics, everything from sales growth to rep-wise conversions, all in one place.
Instead of digging through reports, you can instantly see what’s working and what’s not. These dashboards extract data from your CRM, email, or call tracking tools, enabling you to identify trends easily. If your pipeline slows down or a representative's performance dips, you can adjust your strategy in real-time.
Use KPI-Tracking Tools and Integrations
Platforms like Google Data Studio, Power BI, and Tableau let you go beyond basic reporting. They integrate with CRMs, marketing tools, and call platforms to create custom dashboards that highlight the KPIs that matter most.
For example, by connecting HubSpot with Google Data Studio, you can track metrics like Customer Acquisition Cost (CAC), Monthly Recurring Revenue (MRR), or lead response time and visualize how different channels (email, calls, social) impact your conversions.
Automate Forecasting with AI and Predictive Analytics
AI tools like 6Sense or Clearbit help you forecast smarter. They analyze past behavior to predict which leads are likely to convert, when to follow up, and how much pipeline value you’re really looking at.
This eliminates the guesswork involved in prioritizing leads. You can track pipeline velocity, identify high-value opportunities, and tailor your outreach using real data, not just instinct.
Valley takes this a step further by using those same insights to suggest and automate next steps, like reaching out to a warm lead who’s gone quiet, or adapting your tone based on win-rate trends so you’re always working with up-to-date guidance.
Review and Refine Your KPIs
Your business changes, and so should your KPIs. Set regular times to review and adjust what you’re measuring to match your current goals.
If churn is rising, it might be time to shift focus from acquisition to retention. These reviews help keep your metrics aligned with what matters most right now.
Run Regular Sales Performance Check-ins
Weekly or monthly reviews are a great way to track progress on KPIs like quota attainment, win rates, or sales per rep. They provide managers with the opportunity to identify trends, coach team members, and remove roadblocks.
You can also use these sessions to celebrate wins, address bottlenecks (like long sales cycles), and keep everyone motivated.
Monitor Customer Feedback for Deeper Insight
Customer feedback provides valuable insights into key metrics such as retention, satisfaction, and lifetime value. Tools like NPS surveys or review platforms can be integrated into your CRM to capture this data.
By tracking feedback-driven KPIs, your sales process doesn’t end at closing the deal. Instead, it encourages long-term relationships, encourages repeat business, and promotes customer advocacy.
Once you’ve figured out how to track your KPIs, the next step is choosing the right tools to visualize and monitor them easily. That’s where sales KPI dashboards come in.
What Sales KPI Dashboards Should You Use?
Sales KPI dashboards act as a central hub for tracking, visualizing, and accessing all your key sales metrics. A well-designed dashboard provides real-time visibility into the key numbers, enabling sales leaders to make informed decisions and guide their teams toward improved results.
Here’s a look at the essential types of sales KPI dashboards every team should consider using:
Sales Performance Dashboard
This dashboard offers a clear snapshot of how well your sales team is performing against its goals. It helps you evaluate both individual and team performance using core KPIs that reflect efficiency and output. Key KPIs to track include:
Sales Quota Attainment
Lead Conversion Rate
Win Rate
Sales Growth
Revenue per Sales Rep
Sales Pipeline Dashboard
Focused on pipeline health, this dashboard displays the progression of deals through each stage of the funnel. It helps you understand where opportunities are stalling and how quickly leads are moving. Key KPIs to track include:
Number of Sales Opportunities
Pipeline Velocity
Total Pipeline Value
Deal Stage Distribution
Projected Revenue
Sales Activity Dashboard
This dashboard tracks your team’s daily outreach and engagement efforts, including calls, emails, meetings, and demos. It’s great for measuring rep productivity and seeing how activity translates into outcomes. Key KPIs to track include:
Number of Calls Made
Emails Sent
Meetings Booked
Demos Conducted
Offers Sent
Customer Success Dashboard
Once a deal is closed, this dashboard helps you measure how well customers are being supported. It focuses on retention and satisfaction to ensure long-term relationship building. Key KPIs to track include:
Customer Retention Rate
Churn Rate
Net Promoter Score (NPS)
Customer Satisfaction Score (CSAT)
Customer Lifetime Value (CLV)
Revenue Dashboard
The revenue dashboard gives a high-level view of your sales earnings, broken down by product, region, rep, or customer type. It helps you track revenue growth and understand where the biggest contributions are coming from. Key KPIs to track include:
Monthly Recurring Revenue (MRR)
New Business Revenue
Repeat Business Revenue
Overall Sales Growth
Revenue per Sales Rep
Lead Generation Dashboard
This dashboard focuses on how effectively your team generates and converts leads. It helps you track marketing ROI and identify which sources are generating the best leads. Key KPIs to track include:
Number of New Leads
Cost per Lead (CPL)
Lead Conversion Rate
Lead Source Breakdown
Lead Response Time
Sales Forecasting Dashboard
Designed to predict future sales, this dashboard uses current and historical data to project revenue. It helps you identify potential shortfalls and plan ahead with more confidence. Key KPIs to track include:
Projected Pipeline Sales Value
Forecast Accuracy
Sales Velocity
Pipeline Conversion Rate
Sales Compensation Dashboard
This dashboard tracks how performance ties to compensation. It ensures reps are rewarded fairly and motivates teams by linking payouts directly to results. Key KPIs to track include:
Commission Earned
Bonus Attainment
Incentive Payouts
Quota Attainment
Also Read: B2B Sales Cycle Playbook: From Prospect to Partnership.
How Valley Helps You Put Sales KPIs into Action?
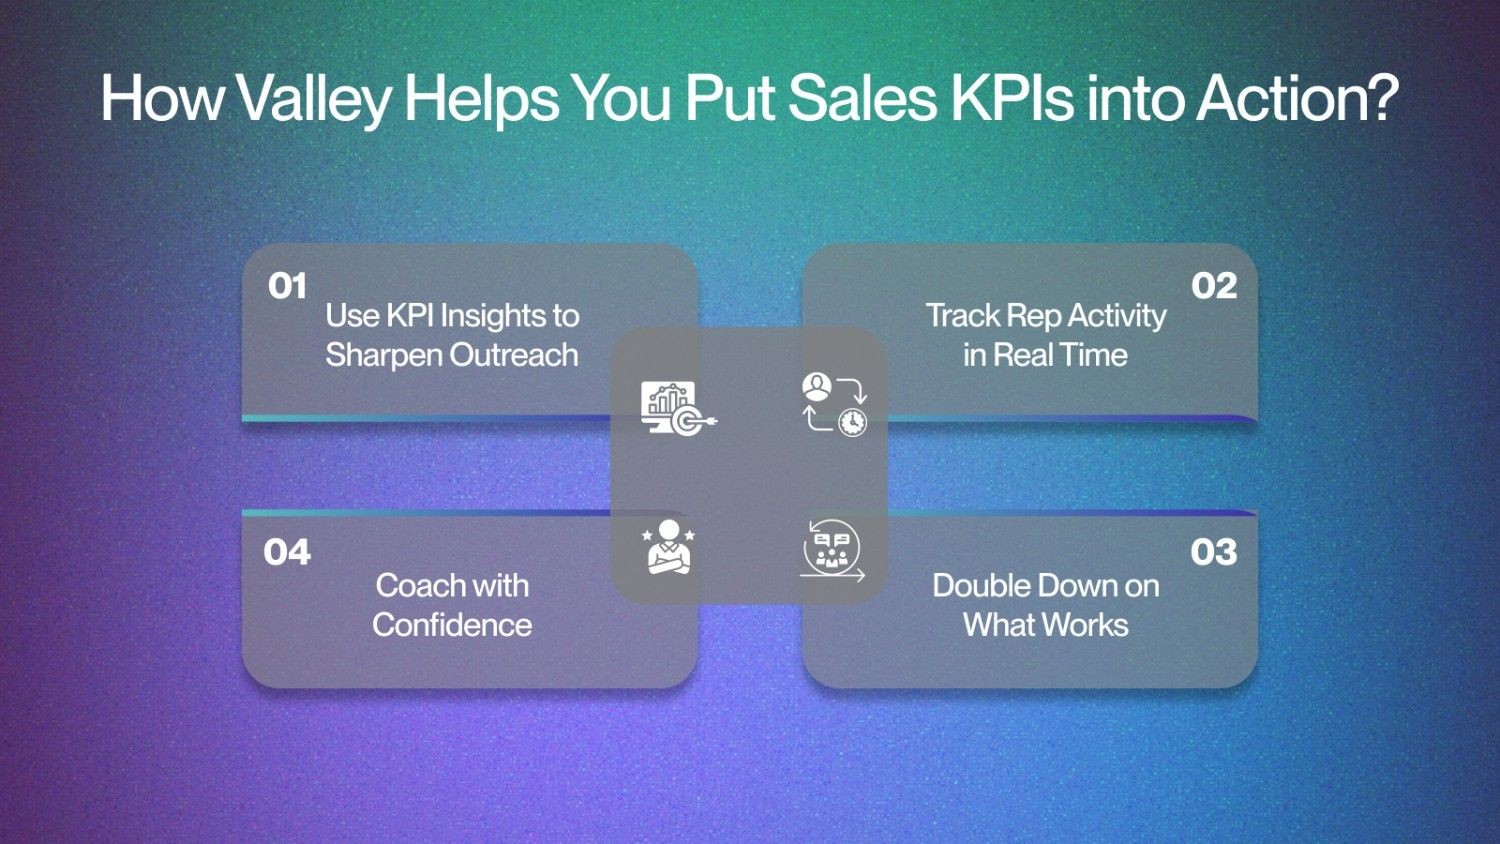
Sales KPIs are essential, but they only move the needle when you take action. In 2025, tracking numbers alone will not be enough. You need a tool that helps your team connect those insights to real-world sales activity. That’s what Valley is built for.
Valley helps sales teams bring KPIs like win rate, lead response time, and pipeline velocity to life by turning insights into action plans. Here’s how it works:
Use KPI Insights to Sharpen Outreach: Valley doesn’t just show you the numbers; it helps your team act on them. Whether it’s quicker follow-ups or refining email messaging, Valley identifies opportunities to improve.
Track Rep Activity in Real Time: Valley integrates with your CRM to give you a live view of sales activity so you can monitor deal progress, outreach efforts, and KPIs in one place.
Double Down on What Works: Valley continuously tests your outreach across channels. If a certain message or approach boosts conversions, your whole team can learn from it and apply it.
Coach with Confidence: With real-time performance data and clear insights into what’s working, managers can deliver better coaching and help reps improve faster, without guesswork.
Your KPIs show you where to improve. Valley helps you do it faster, smarter, and at scale.
Book a Demo to see how Valley turns performance data into results that close deals.
Final Words
Sales KPIs aren’t just numbers; they’re the foundation of a strong sales strategy. Tracking the right ones provides you with the clarity to make smarter decisions, fine-tune your processes, and increase revenue.
But collecting the right data, making sense of it, and using it to guide outreach can be time-consuming. That’s where Valley comes in. It not only automates the research and outreach process but also integrates intent signals and performance insights, so you’re always acting on what matters most.
With Valley, your team doesn’t just track KPIs; they use them to drive pipeline and close more deals.
FAQs
Q1. What are some common sales KPIs?
A1. Some of the most common sales KPIs include:
Total revenue
Number of deals closed
Average deal size
Conversion rate
Sales cycle length
Q2. How do you choose the right sales KPIs?
A2. The right KPIs depend on your sales goals, team setup, and business model. Start by aligning KPIs with your top priorities, whether that’s scaling growth, improving efficiency, or boosting customer retention.
Q3. How often should sales KPIs be tracked?
A3. That depends on your reporting rhythm, but generally, KPIs should be tracked weekly, monthly, or quarterly. Regular tracking helps you spot trends early and make timely decisions.
Q4. Can sales KPIs help improve forecasting?
A4. Absolutely. Historical sales KPIs reveal patterns in your pipeline, deal cycles, and revenue trends. This data gives you a stronger foundation for building accurate forecasts and planning ahead with confidence.


" width="103px"><path d="M 0 0 L 103 0 L 103 23.918 L 0 23.918 Z" fill="transparent" height="23.918410041841003px" id="vUSjJ_lFQ" width="103px"/><path d="M 58.251 23.667 C 57.634 23.667 57.213 23.611 56.484 23.47 L 56.484 21.226 C 56.961 21.282 57.213 21.31 57.662 21.31 C 58.756 21.31 60.047 20.749 60.608 18.504 L 54.828 4.335 L 57.83 4.335 L 62.011 15.277 L 62.067 15.277 L 65.995 4.335 L 68.885 4.335 L 63.218 18.981 C 61.843 22.516 60.468 23.667 58.251 23.667 Z M 54.433 11.181 C 54.433 11.574 54.433 11.995 54.405 12.219 L 43.406 12.219 C 43.462 14.604 44.865 16.821 47.699 16.821 C 50.224 16.821 51.206 15.193 51.458 14.239 L 54.264 14.239 C 53.507 16.989 51.402 19.066 47.642 19.066 C 43.097 19.066 40.572 15.839 40.572 11.462 C 40.572 6.972 43.265 3.886 47.642 3.886 C 51.992 3.886 54.433 6.748 54.433 11.181 Z M 35.465 1.019 L 35.465 18.645 L 38.215 18.645 L 38.215 0.041 Z M 29.629 0.978 L 29.629 18.645 L 32.379 18.645 L 32.379 0 Z M 43.406 10.059 L 51.571 10.059 C 51.571 7.814 49.999 6.13 47.558 6.13 C 45.258 6.13 43.574 7.702 43.406 10.059 Z M 18.679 19.037 C 15.817 19.037 13.994 17.382 13.994 14.941 C 13.994 11.742 16.407 10.788 19.97 10.115 C 22.215 9.694 23.59 9.414 23.59 8.011 C 23.59 6.972 22.972 6.103 20.868 6.103 C 18.371 6.103 17.613 6.888 17.473 8.796 L 14.667 8.796 C 14.807 6.047 16.603 3.886 20.98 3.886 C 23.926 3.886 26.283 5.121 26.283 8.824 L 26.283 15.39 C 26.283 16.428 26.423 16.961 26.956 16.961 C 27.041 16.961 27.125 16.961 27.293 16.933 L 27.293 18.616 C 26.816 18.729 26.339 18.785 25.89 18.785 C 24.516 18.785 23.786 18.252 23.618 16.624 L 23.562 16.624 C 22.636 18.111 21.008 19.037 18.679 19.037 Z M 19.297 16.821 C 21.766 16.821 23.59 15.558 23.59 13.061 L 23.59 11.013 C 23.141 11.434 21.906 11.742 20.447 12.051 C 17.922 12.556 16.856 13.257 16.856 14.745 C 16.856 16.091 17.585 16.821 19.297 16.821 Z M 8.193 18.783 L 5.106 18.783 L 0 4.473 L 2.946 4.473 L 6.706 15.949 L 6.734 15.949 L 10.438 4.473 L 13.299 4.473 L 8.193 18.783 Z" fill="rgb(0, 0, 0)" height="23.666727355031288px" id="l2AdXd8LU" transform="translate(34.057 0.209)" width="68.88523563362668px"/><path d="M 23.175 2.278 L 16.644 8.81 L 25.777 8.81 L 25.777 12.032 L 19.531 12.032 L 16.475 8.978 L 14.197 6.7 L 20.897 0 Z M 2.601 18.296 L 12.89 8.007 L 14.13 9.248 L 15.168 10.286 L 23.244 18.362 L 20.966 20.64 L 14.5 14.174 L 14.5 23.175 L 11.277 23.175 L 11.277 14.176 L 4.88 20.574 Z M 9.298 8.973 L 6.239 12.032 L 0 12.032 L 0 8.81 L 9.135 8.81 L 2.67 2.345 L 4.948 0.066 L 11.577 6.694 L 9.302 8.969 Z" fill="rgb(0, 0, 0)" height="23.175430977346505px" id="slSBMY0eW" transform="translate(0.057 0.25)" width="25.77715030184949px"/></g></svg>)